
Last update: Jan. 25th, 2011.
| Description | png files | eps files |
|---|---|---|
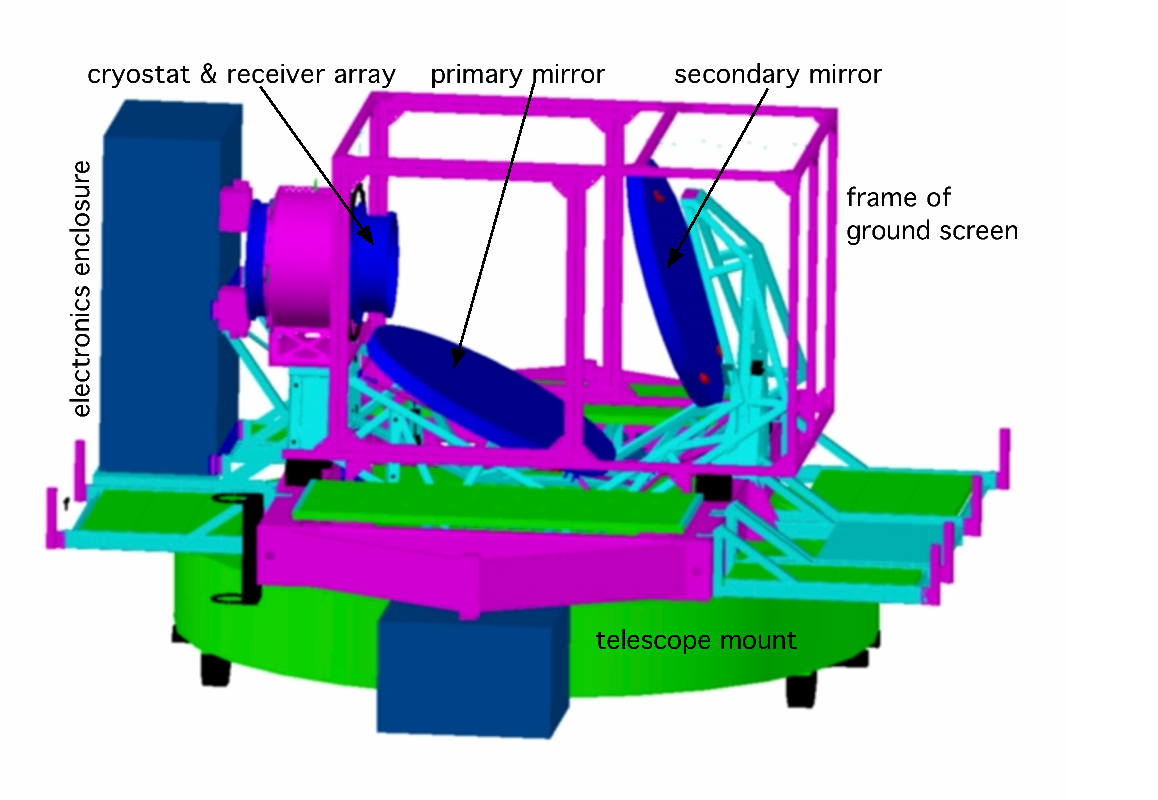
| Overview of QUIET instrument | |
[Fig1] |
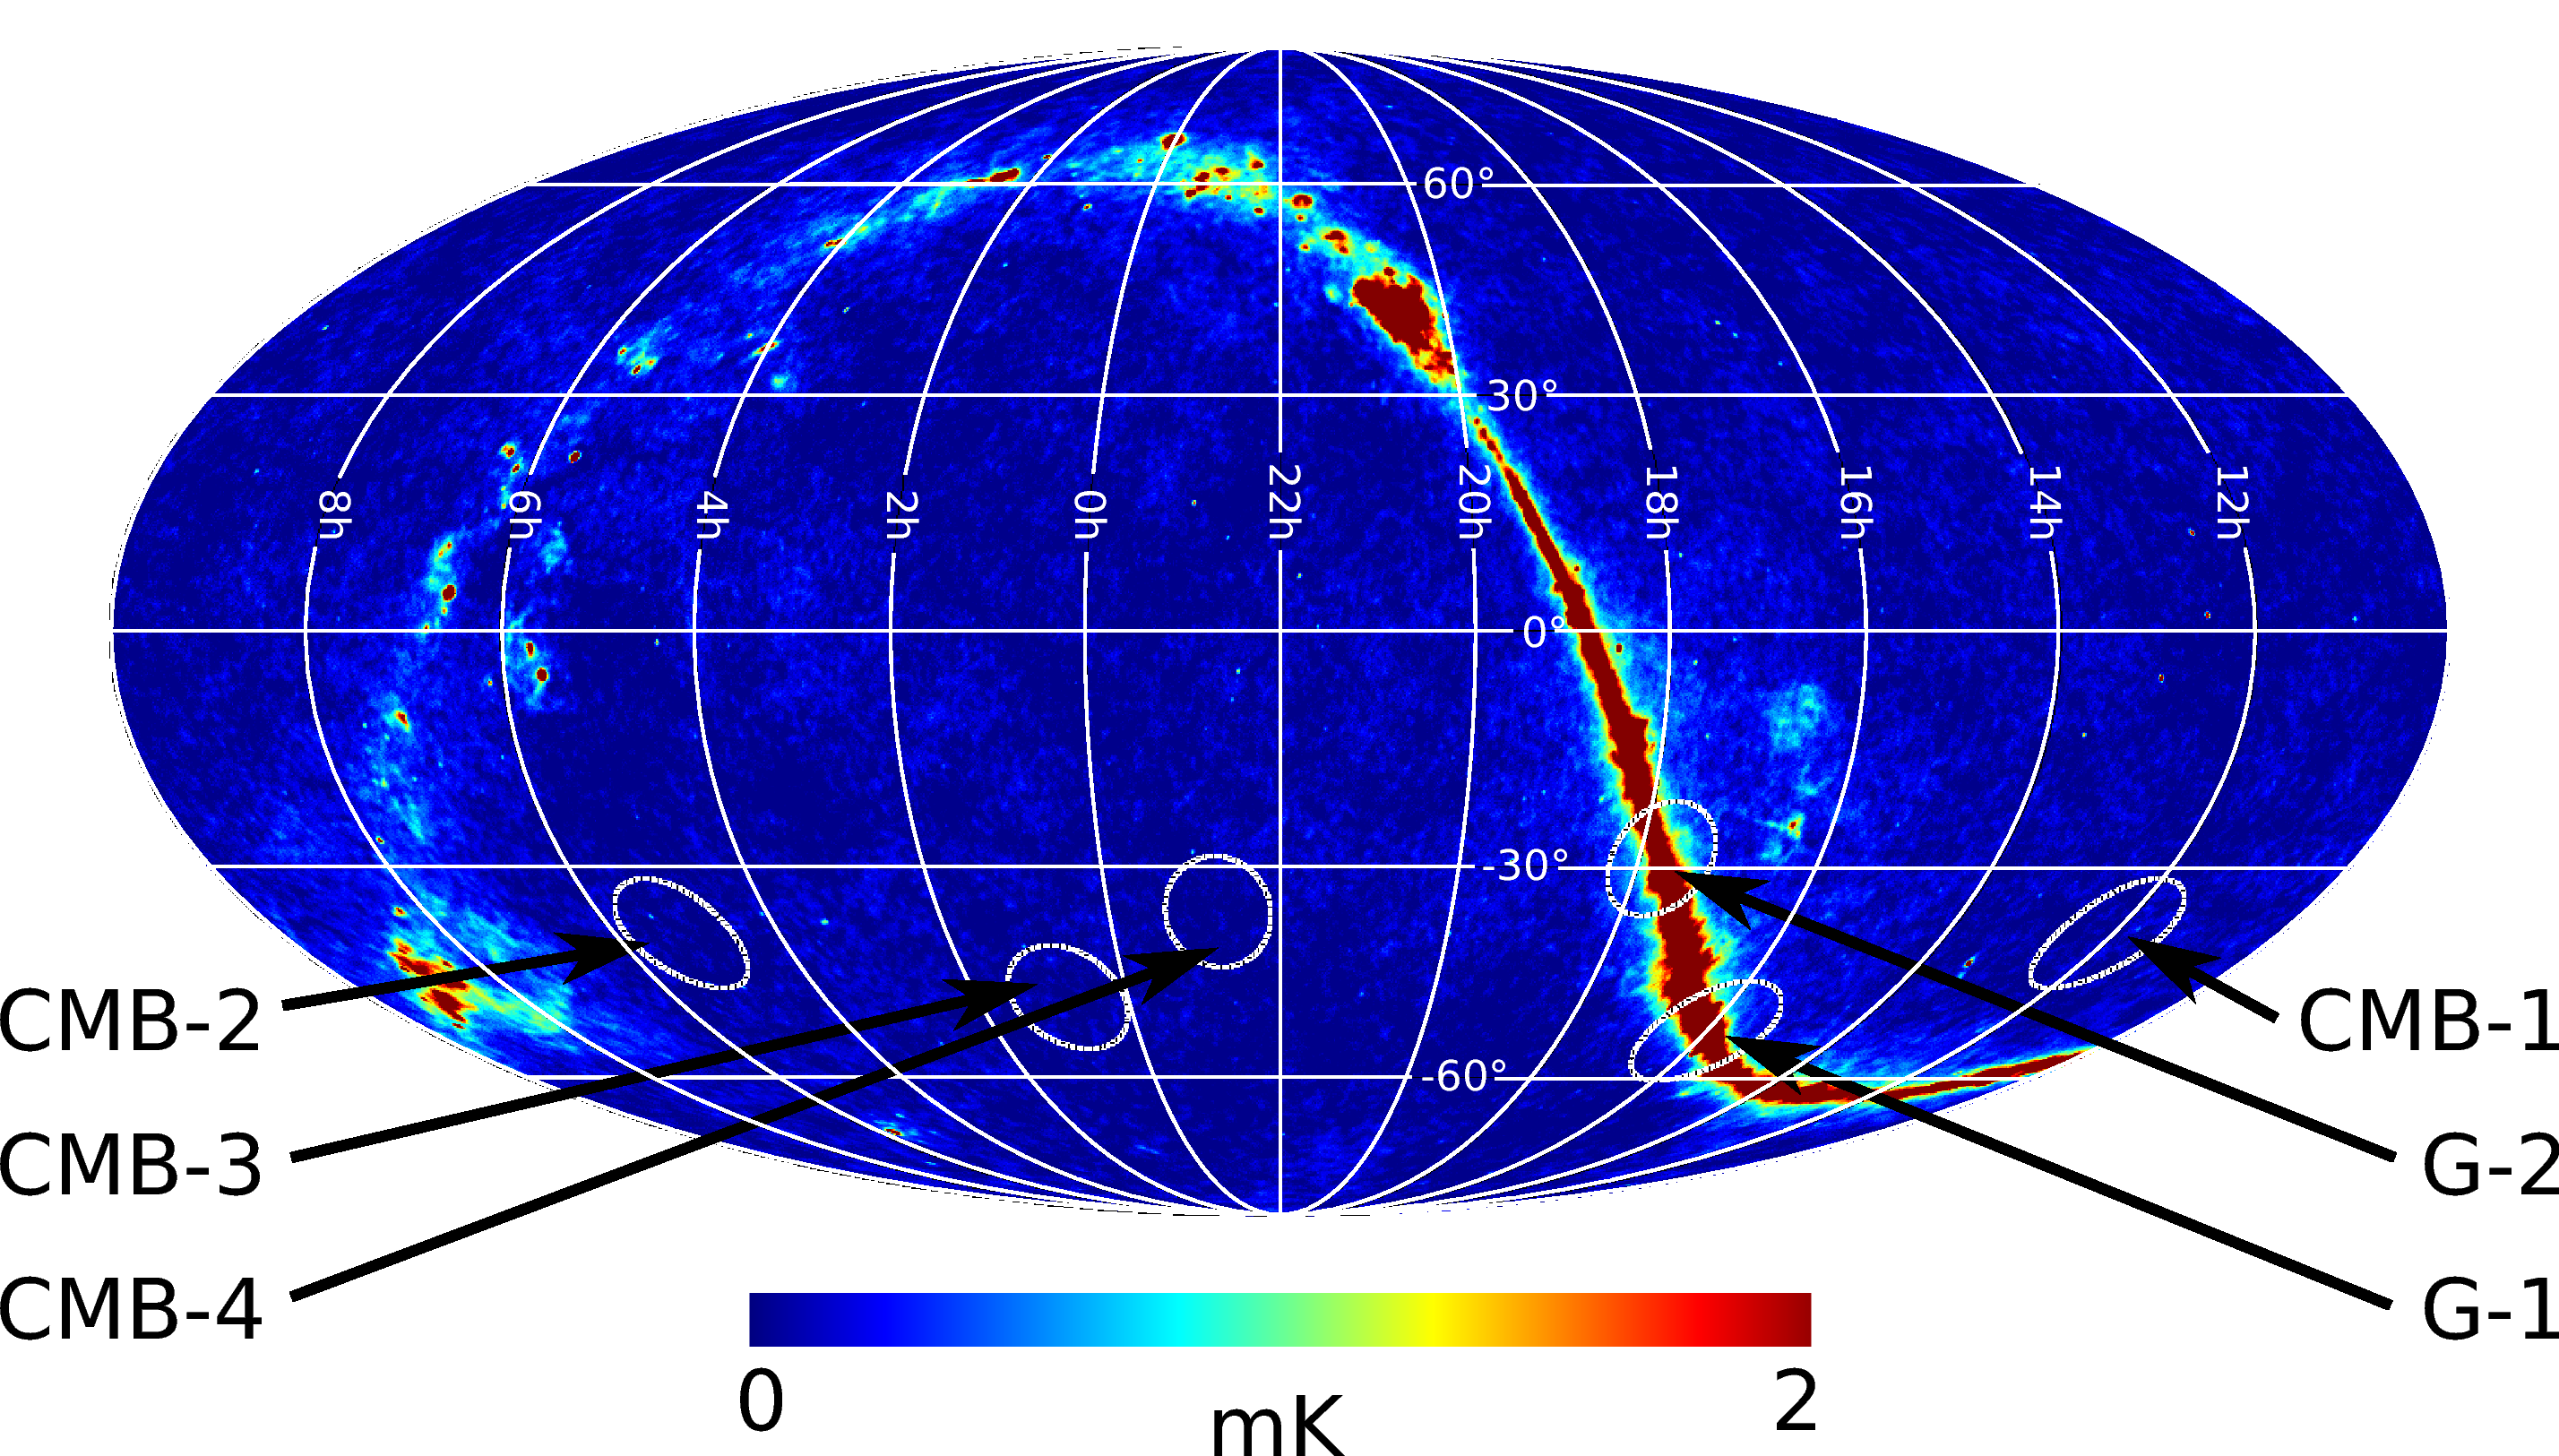
| CMB and Galactic patches observed by QUIET, in equatorial coordinates, superimposed on a Q-band all-sky WMAP 7-year temperature map (Jarosik et al. 2010). | |
[Fig2] |
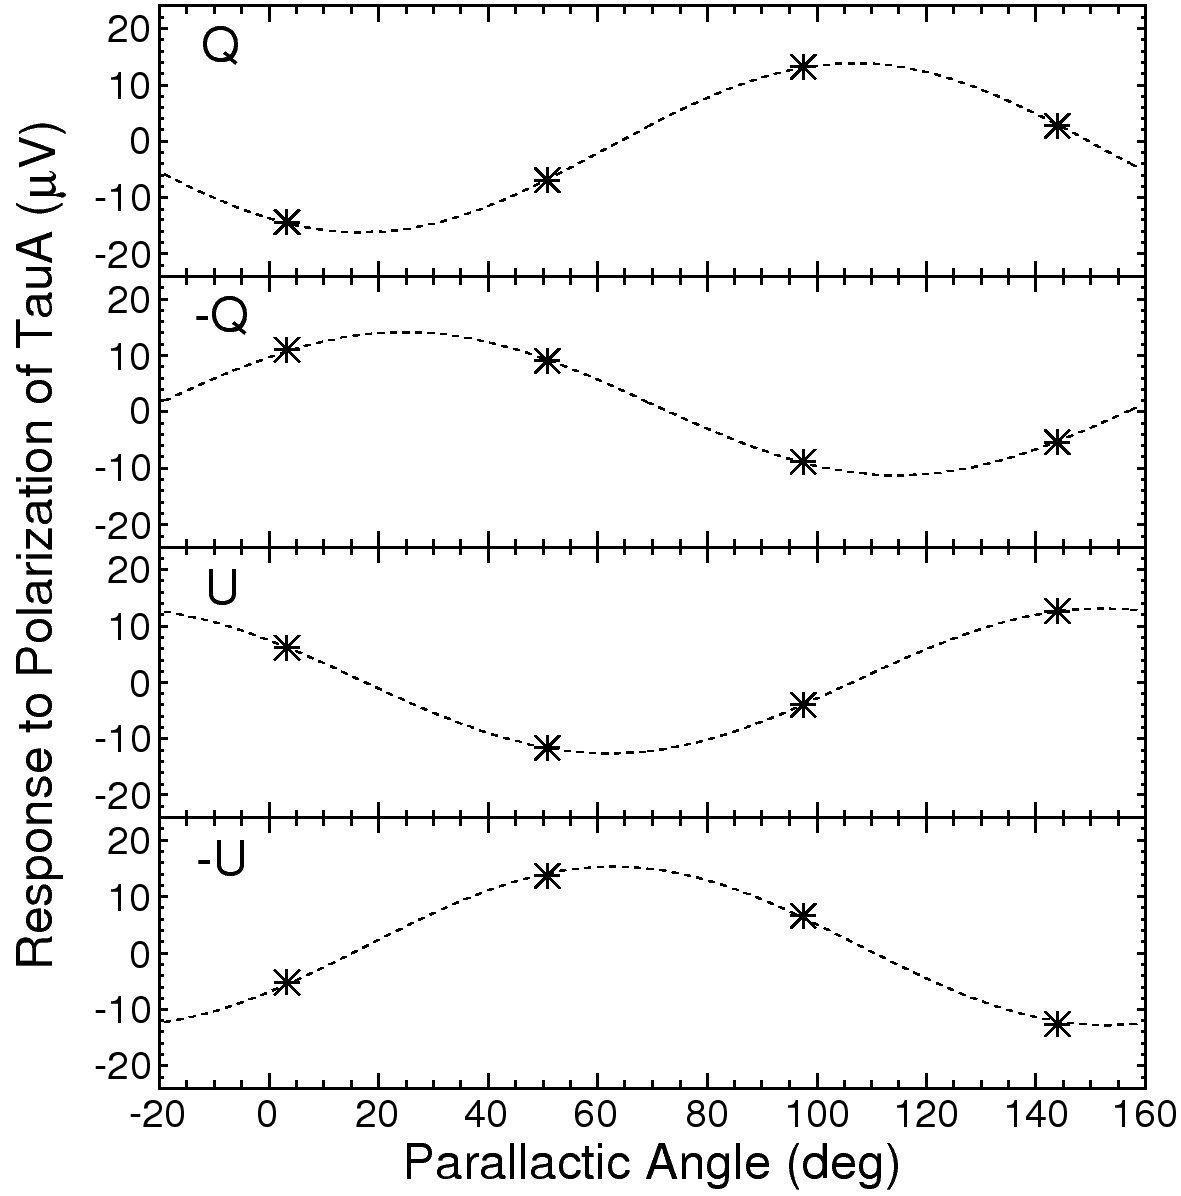
| Polarimeter responses from the central feed horn to the polarization of Tau A at four parallactic angles. | |
[Fig3] |
| Map of the polarization of the Moon from one detector diode. | |
[Fig4] |
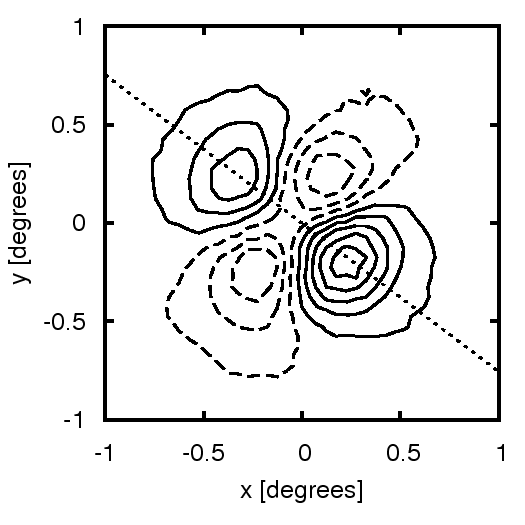
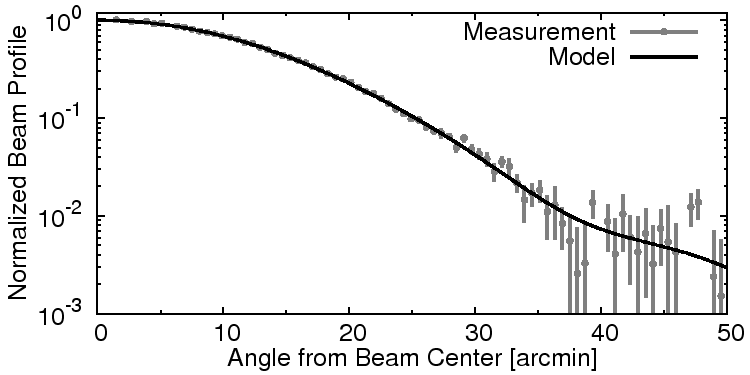
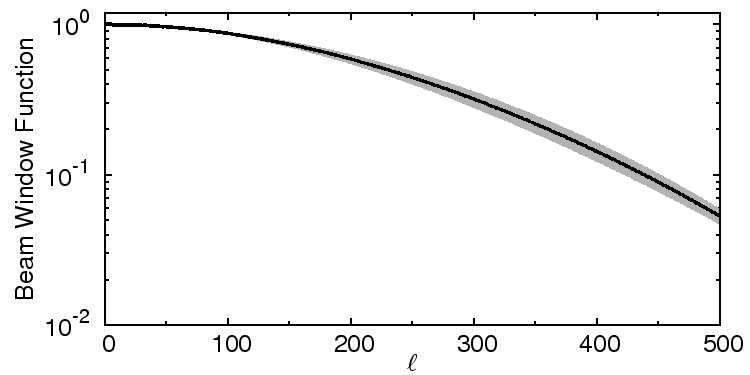
| Fig 5a: Polarization beam profile from Tau A observations with the central feed horn. Fig 5b: Beam window function with errors shown by the gray band. | |
[Fig5a][Fig5b] |
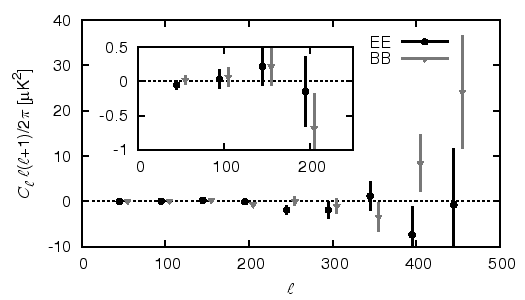
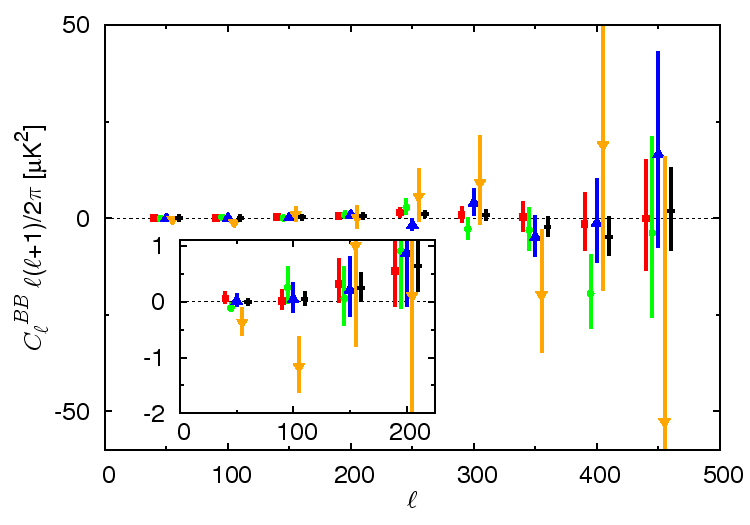
| EE and BB power spectra for the patch CMB-1 null test between Q and U detector diodes | |
[Fig6] |
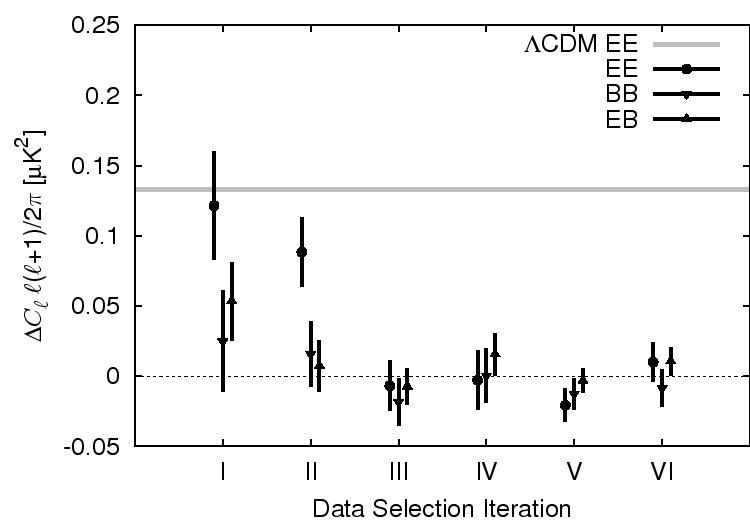
| Power spectra differences between the final data selection and six of the 32 earlier data-selection iterations. | |
[Fig7] |
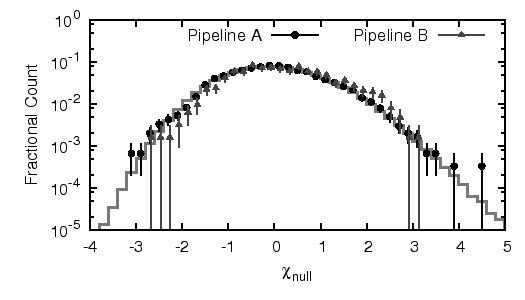
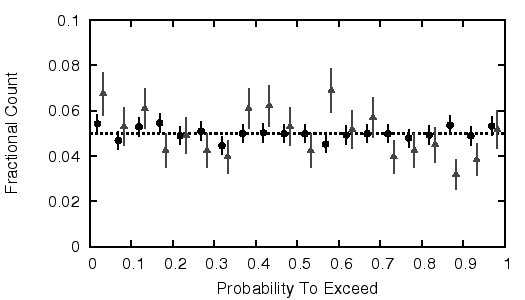
| Null-suite statistics. Fig 8a: Histogram of the χnull values. Fig 8b: Histogram of PTEs calculated from the χnull2 statistic. | |
[Fig8a][Fig8b] |
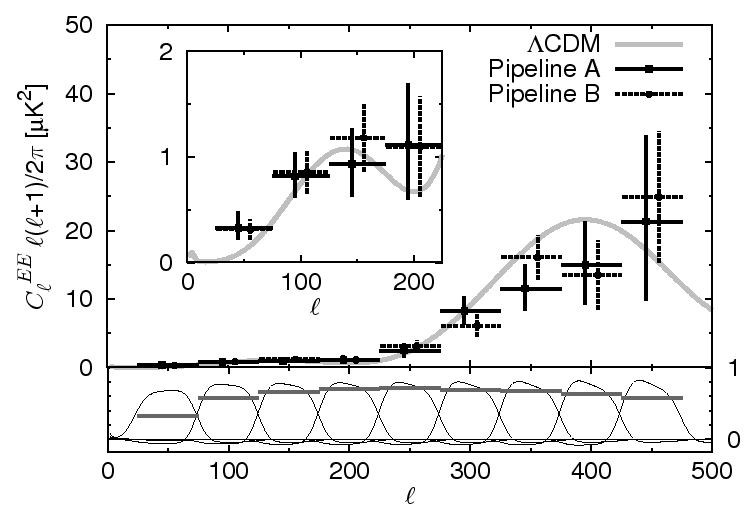
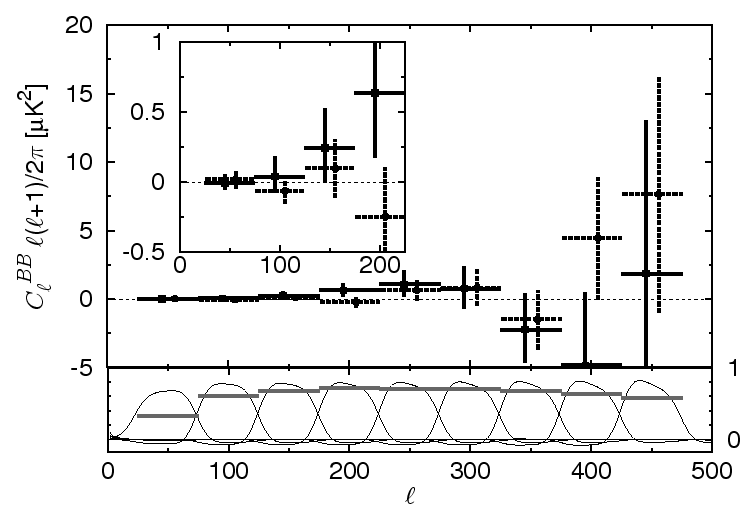
| EE, BB, and BB power spectra from each QUIET pipeline, all four patches combined. | |
[Fig9a][Fig9b][Fig9c] |
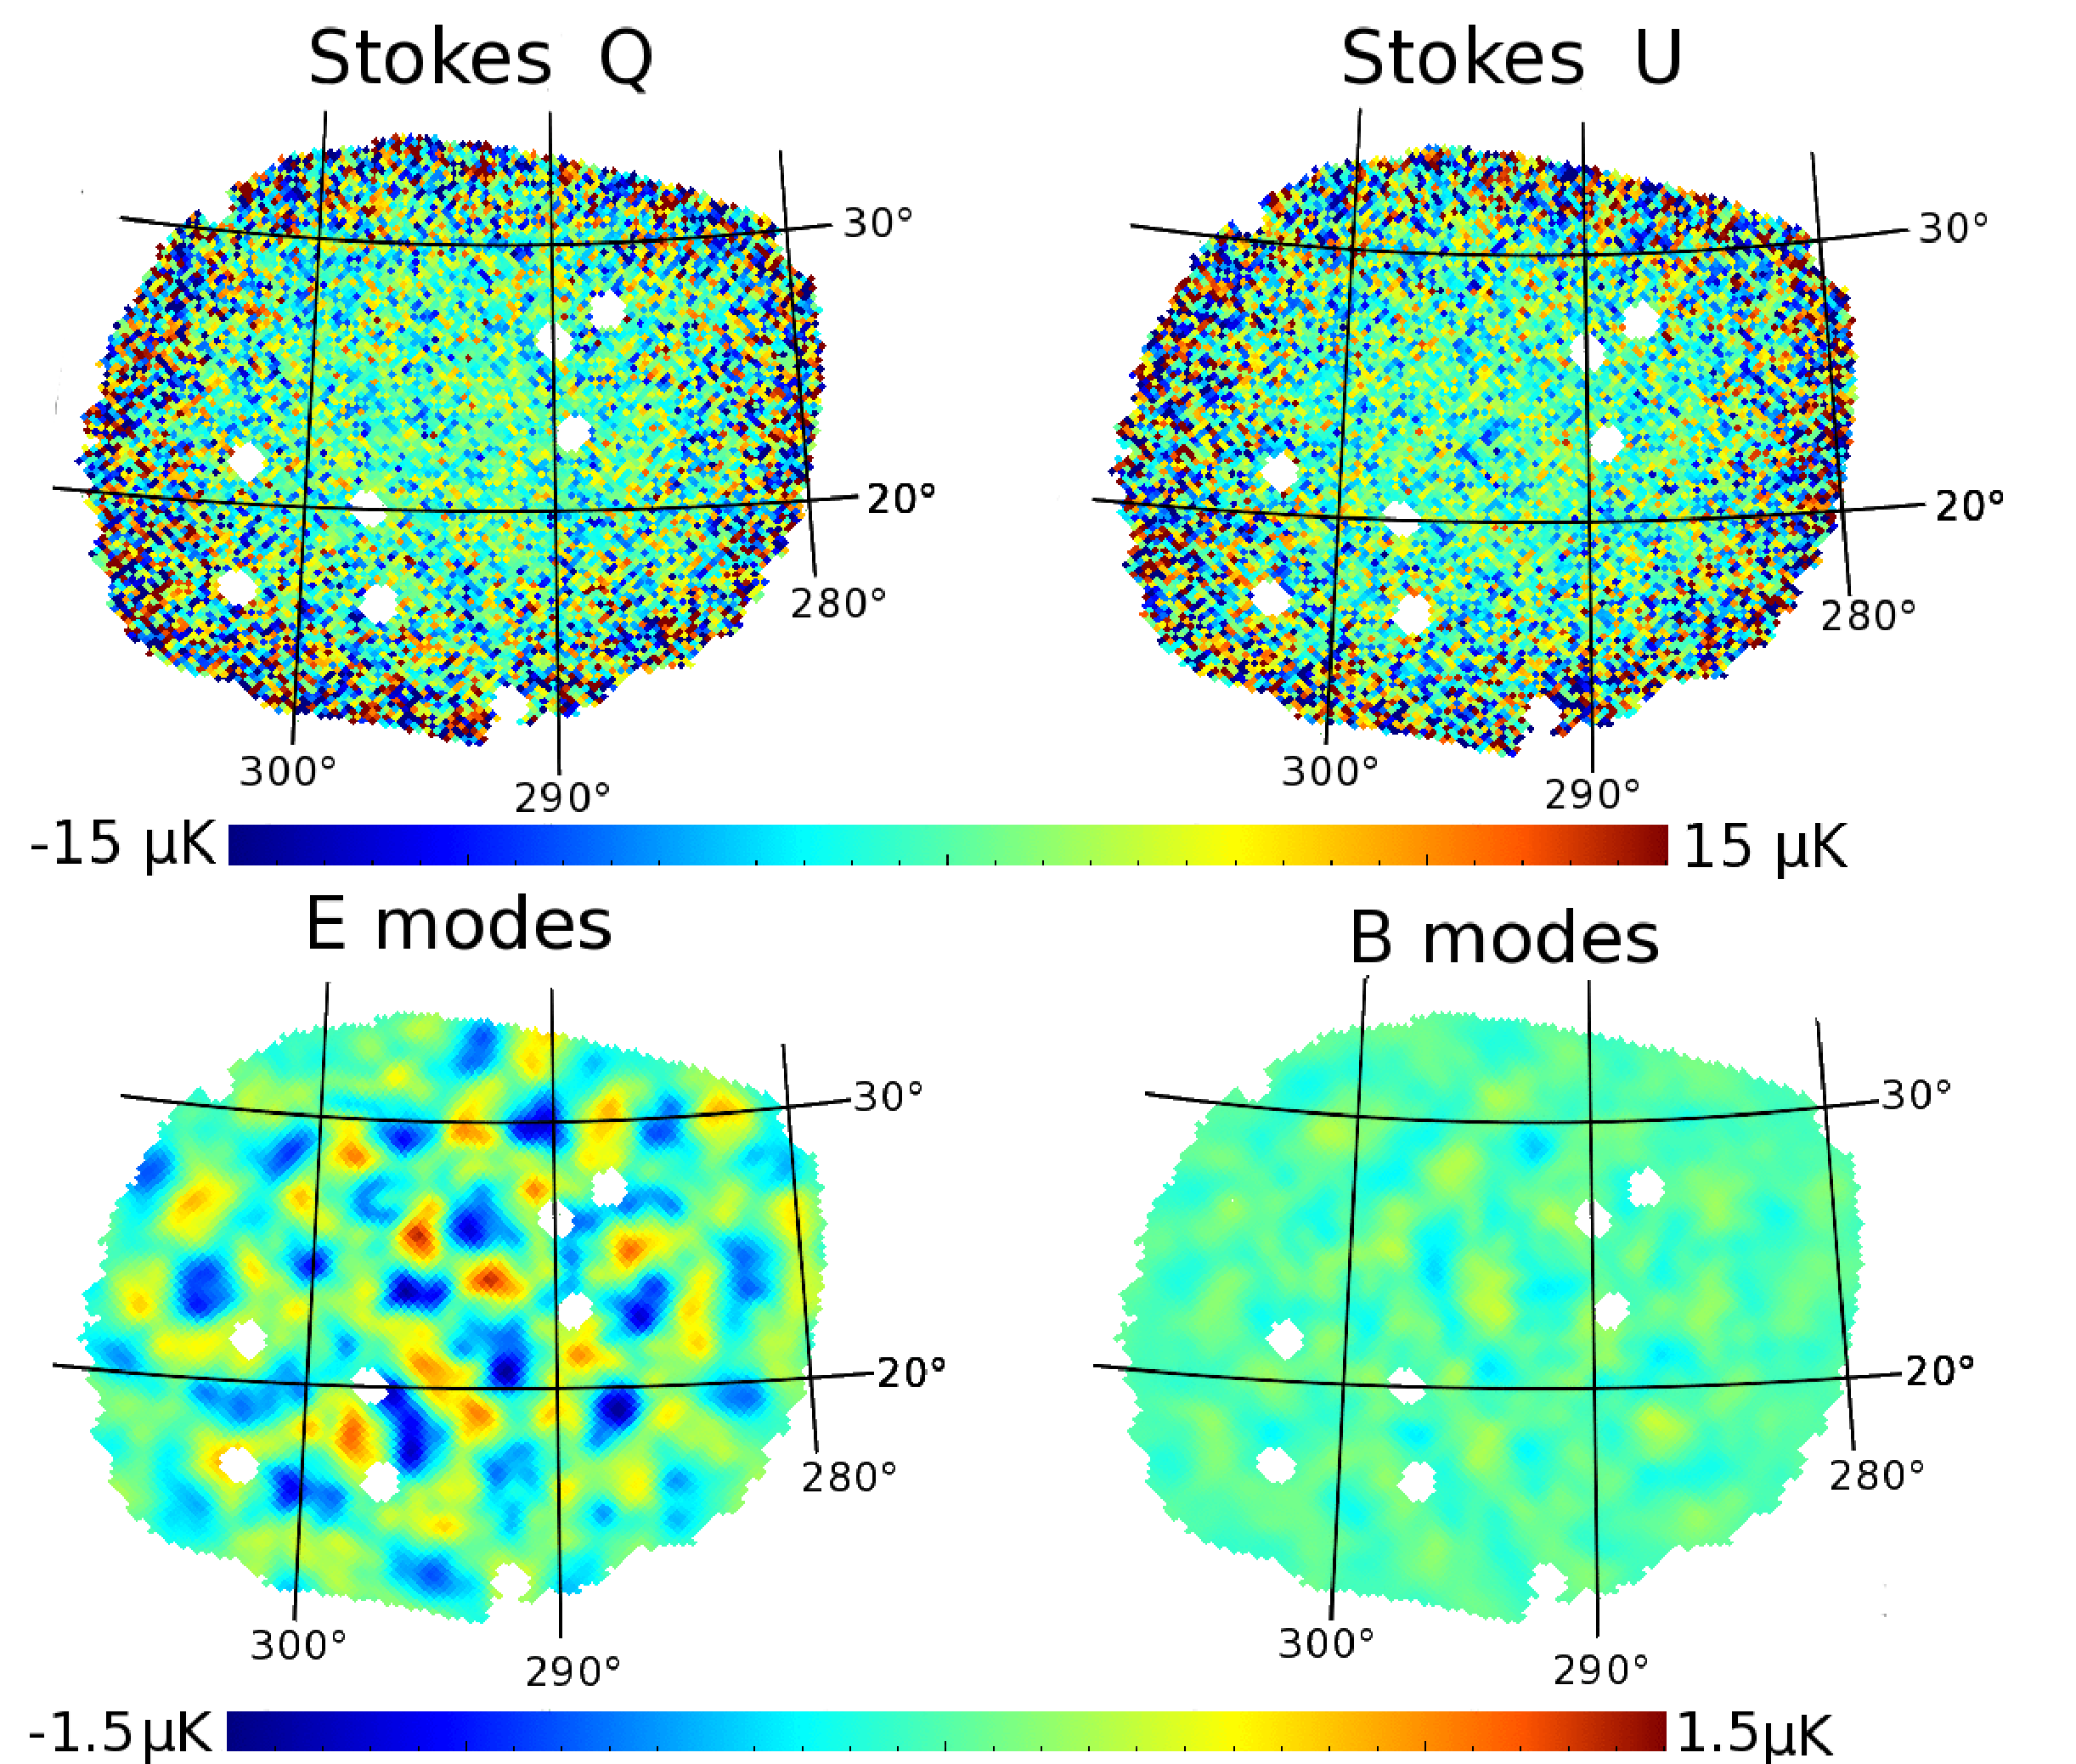
| Maps of patch CMB-1 in Galactic coordinates. | |
[Fig10] |
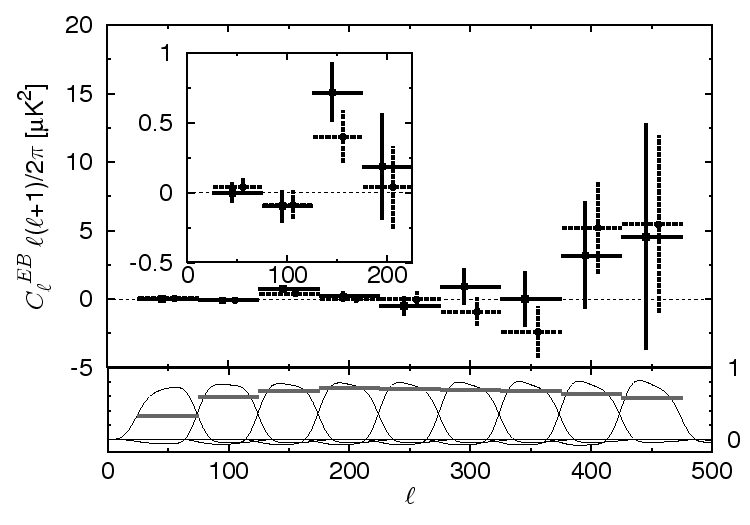
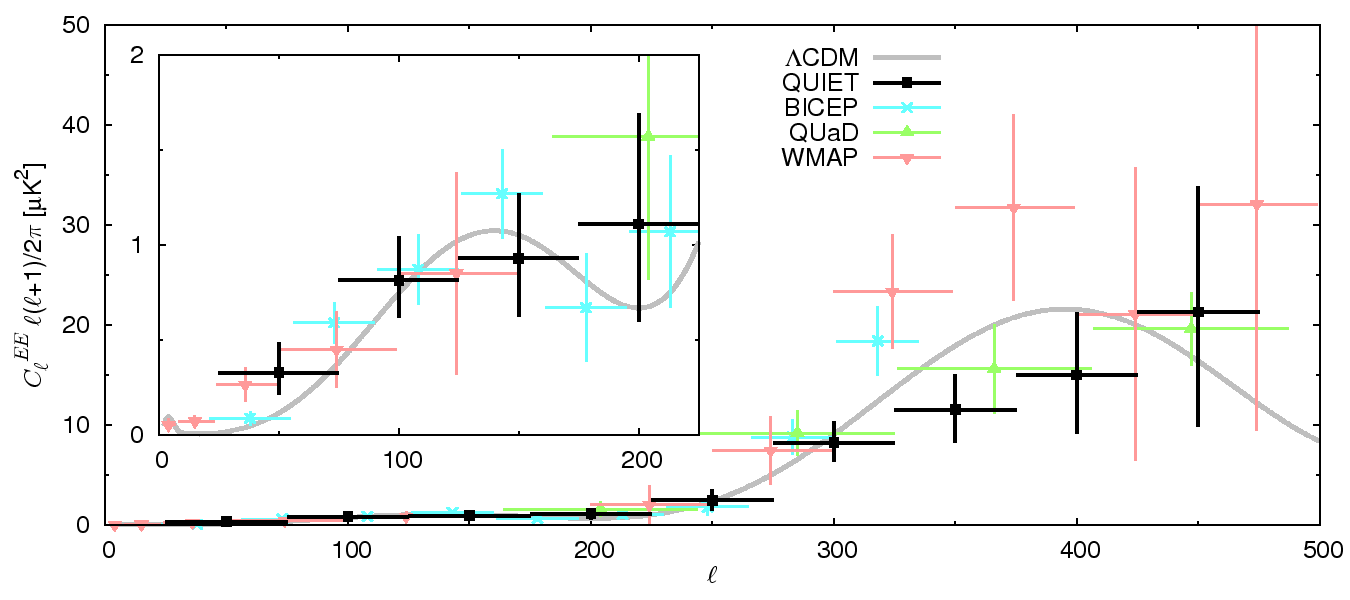
| Fig 11a: EE results with 68% C.L. error bars. Fig 11b: BB 95% C.L. upper limits. For comparison, we also plot results from previous experiments (Brown et al. 2009; Chang et al. 2010; Larson et al. 2010) | |
[Fig11a][Fig11b] |
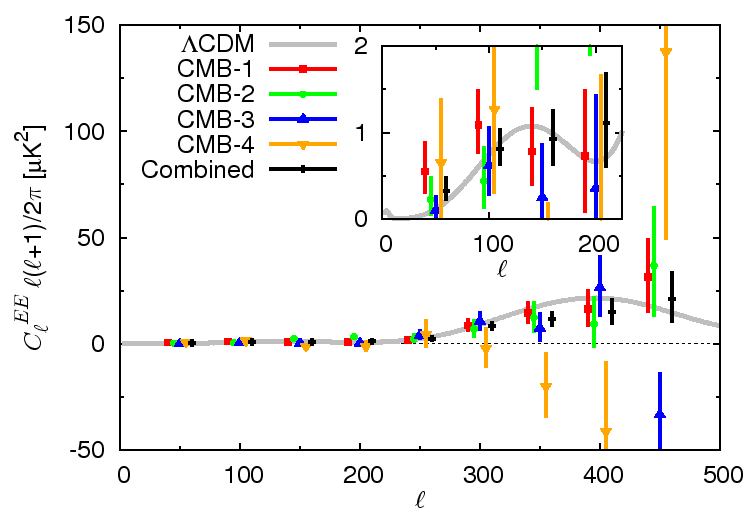
| CMB power spectra for each individual patch. | |
[Fig12a][Fig12b] |
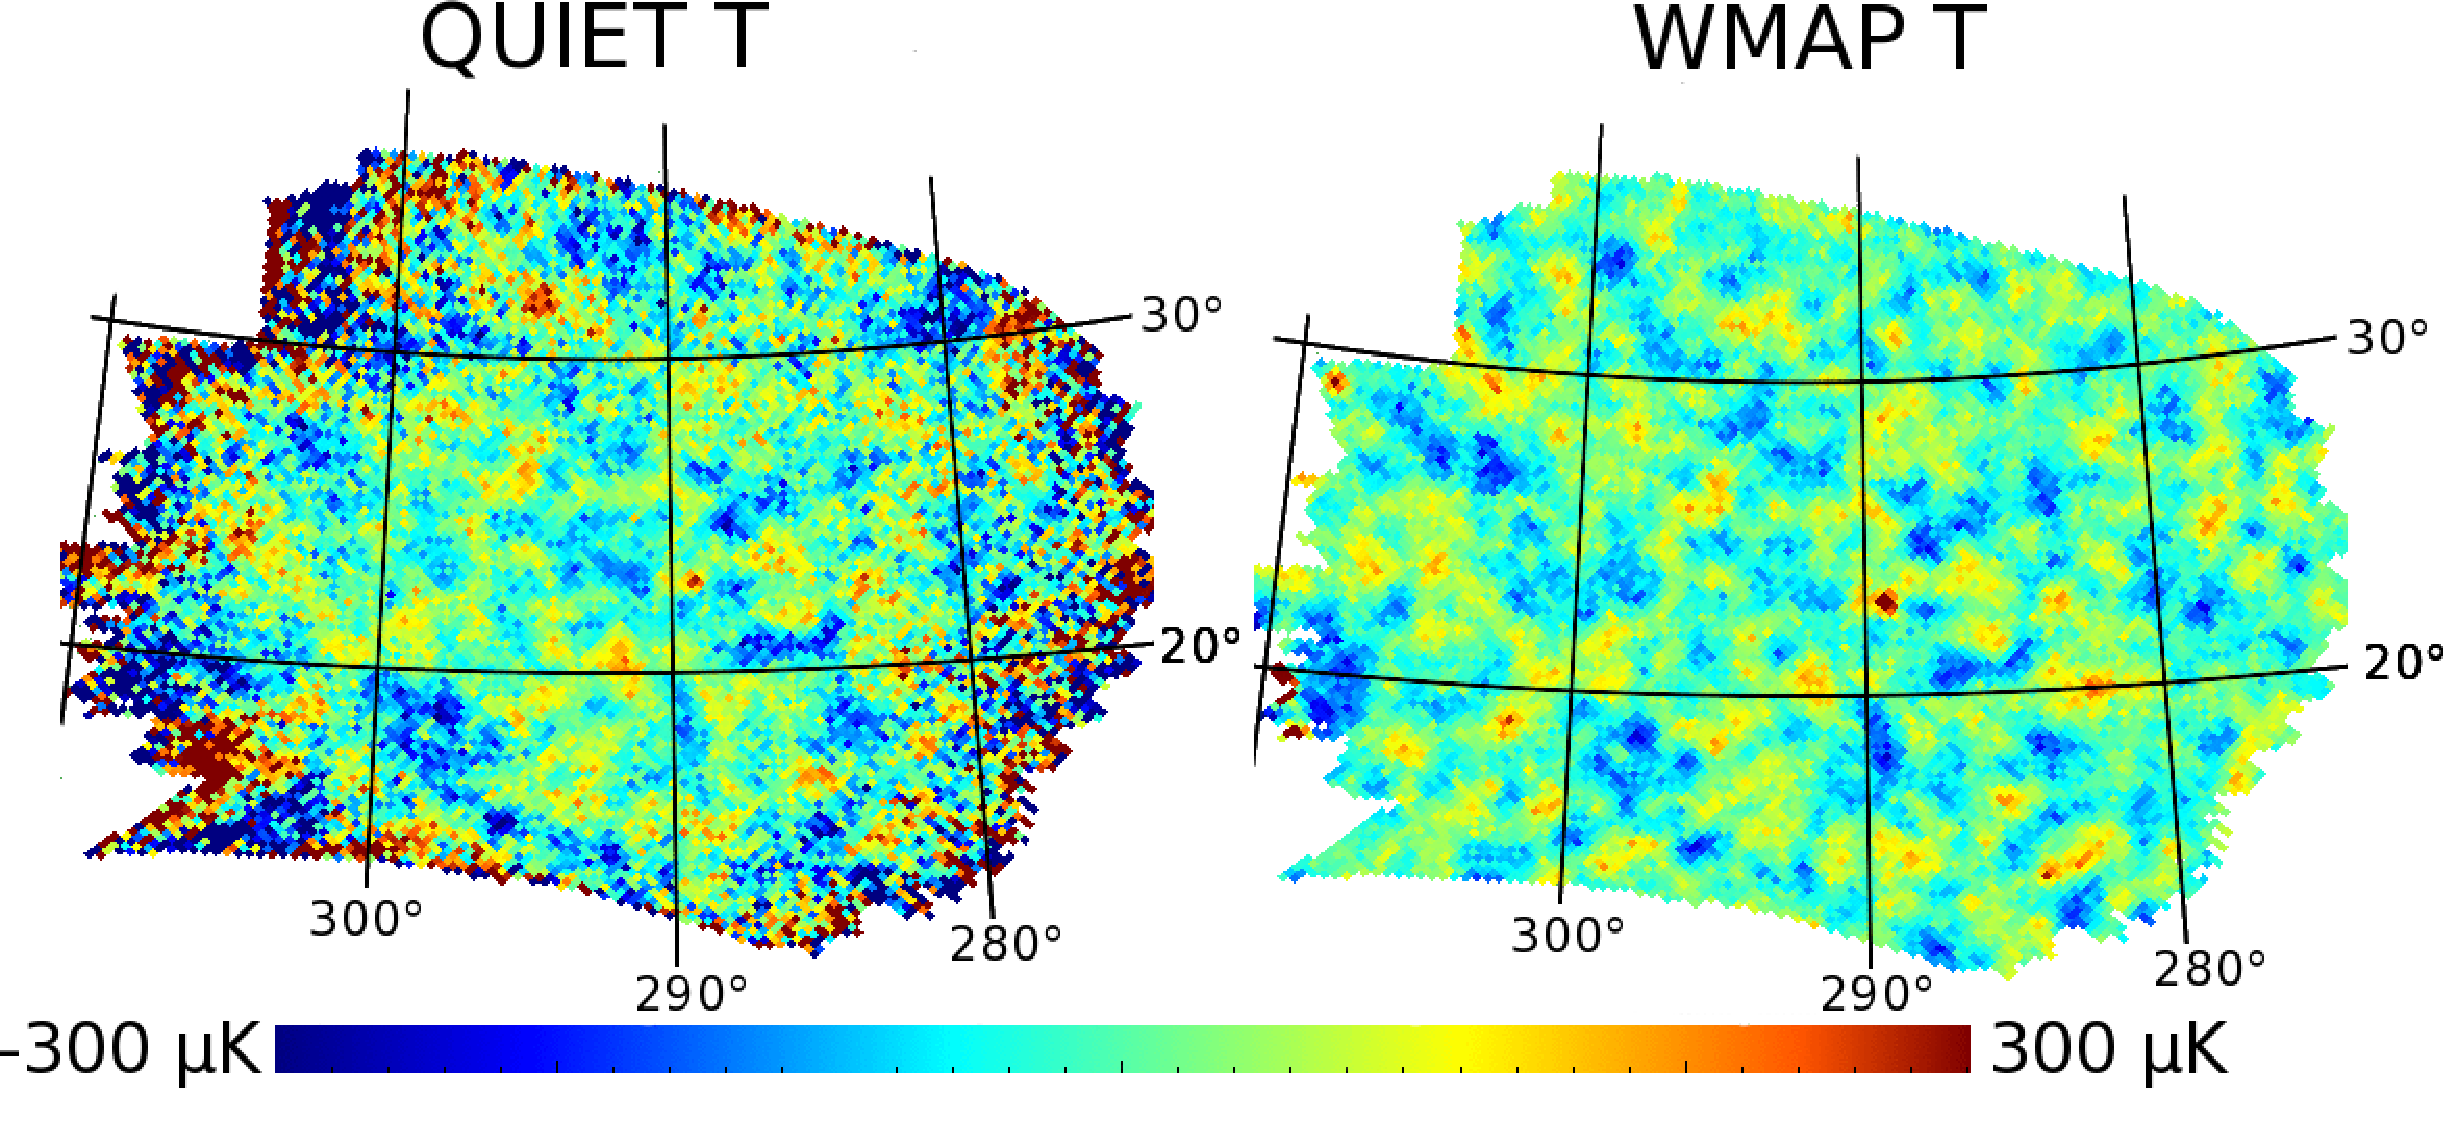
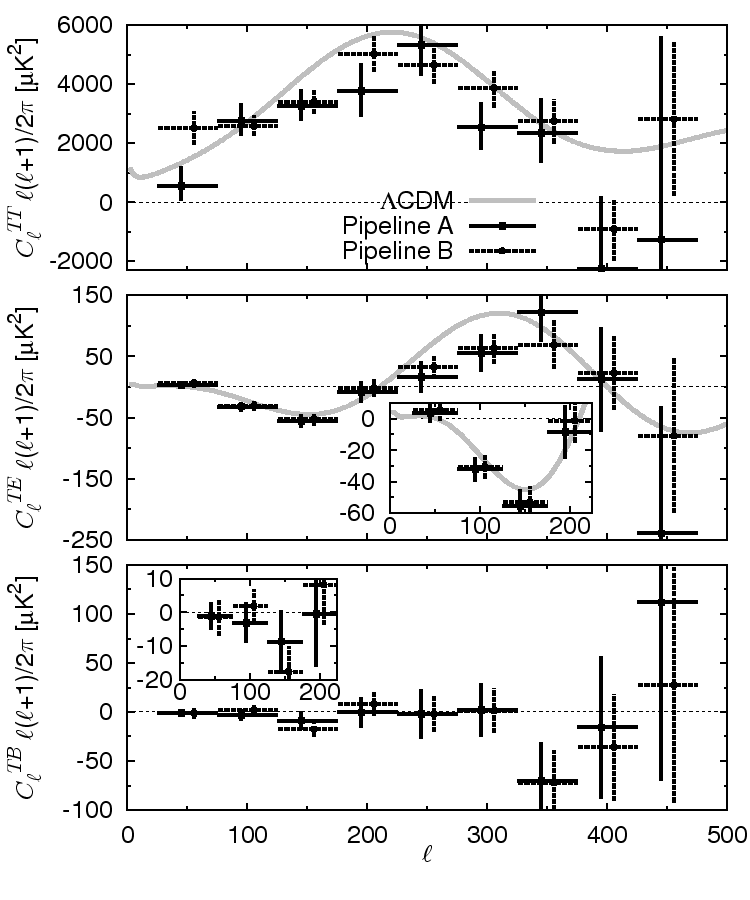
| Fig 13a: Temperature maps from QUIET and WMAP 7-year Q-band map (Jarosik et al. 2010). Fig 13b: CMB temperature power spectra: TT, TE, and TB. | |
[Fig13a][Fig13b] |
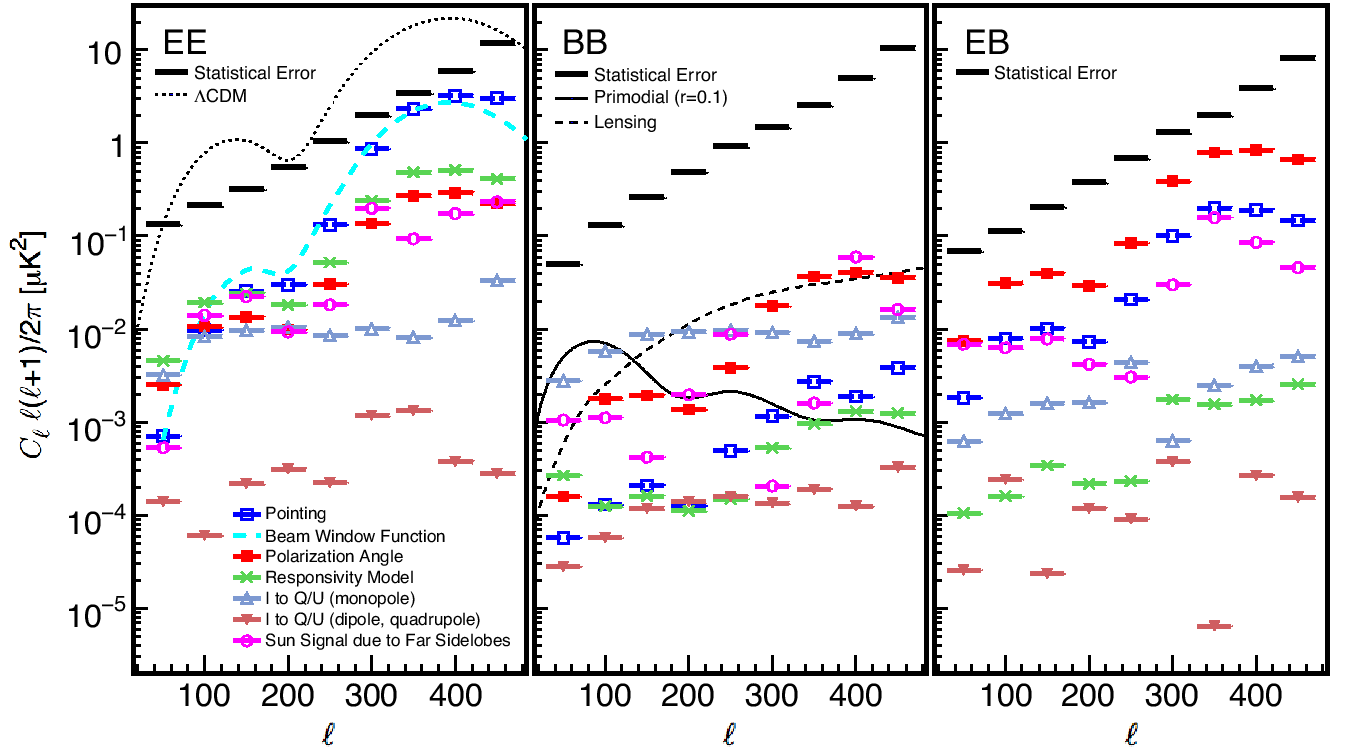
| Systematic uncertainty estimates for EE, BB, and EB power spectra. | |
[Fig14] |
| Category | Name | Value | Description |
|---|---|---|---|
| Instrumentation | Array Sensitivity | 69 μK√s | For polarization sensitive elements |
| Per Module Sensitivity | 280 μK√s | Q & U combined sensitivity | |
| 1/f knee frequency | 5.5 mHz | Median | |
| Phase-switch frequency | 4 kHz / 50 Hz | Primary / Secondary | |
| Number of Elements | 19 (17) | Total (polarization sensitive) | |
| Center Frequency | 43.1 ± 0.4 GHz | Average | |
| Bandwidth | 7.6 ± 0.5 GHz | Average | |
| Primary Mirror Diameter | 1.4 m | ||
| Field of View | 7° | Diameter on the sky | |
| Beam size | 27.3' | FWHM | |
| Site | Coordinates | 67°45'42"W, 23°01'42"S | Chajnantor plateau, Atacama desert, Chile |
| Altitude | 5080 m | ||
| Observation | First Season | October 24, 2008 − June 13, 2009 | With Q-band receiver |
| Second Season | July 2009 − December 2010 | With W-band receiver | |
| First Season Observing Hours | 3458 hours | Including calibration and galactic observations | |
| Number of CMB Patches | 4 | ||
| Observed Area | 1000 square degrees | All four patches combined | |
| Scan Speed | 5°/s | Average, in azimuth | |
| Scan Period | 10−22 seconds | ||
| Patch Location | CMB-1 | 12h04m, −39°00' | Central equatorial coordinates |
| CMB-2 | 05h12m, −39°00' | Central equatorial coordinates | |
| CMB-3 | 00h48m, −48°00' | Central equatorial coordinates | |
| CMB-4 | 22h44m, −36°00' | Central equatorial coordinates | |
| Result | Range of Multipoles (ell) | 25 − 475 | |
| Tensor-to-Scalar Ratio | r=0.35+1.06-0.87 (r<2.2) | 68% C.L. interval (95% C.L. upper limit) |
| Category | Null test |
|---|---|
| Nine Instrumental Effects | 3 Divisions of modules by the bias and readout electronics boards they are connected to |
| The central seven modules vs. the peripheral modules | |
| Modules with high vs. low instrumental polarization | |
| Modules with high vs. low average 1/f knee frequencies | |
| Modules with high vs. low bandpass center frequencies | |
| Q vs U diodes (the example shown in the paper) | |
| Diodes whose TP level sometimes shifts abruptly vs. diodes not having such shifts | |
| 10 Pointing Effects | CES at high vs. low elevation |
| CES with the patch rising vs. setting | |
| 3 Divisions of CES by deck angle | |
| 3 Divisions of CES by Parallactic Angle | |
| Data from left vs. right-moving telescope scan motion | |
| Data from accelerating vs. deccelerating telescope scan motion | |
| Five Sources | Sun proximity to the main beam |
| Moon proximity to the main beam | |
| Far sidelobe elevation high vs. low (note that because of the orientation of the two far sidelobes a test for one's sidelobe elevation is degenerate with a test for the other's sidelobe elevation) | |
| 2 Divisions based on proximity of the two far sidelobes to the Galaxy | |
| Eight TOD Contamination Tests | CES-diodes with more vs. less excess noise power near the scan frequency |
| CES-diodes with more vs. less excess noise power at high frequencies (2--15 Hz) | |
| Division of CES by average responsivity (high vs. low) | |
| Division of CES-diodes by responsivity of each diode compared to its average | |
| Division by CES-diodes with high vs. low non-linearity of double-demodulated vs. TP data | |
| 2 divisions by weather quality based on 10-s timescale TP RMS statistics | |
| CES-diodes with high vs. low white noise amplitudes | |
| 10 Environmental Conditions | Division of CES with high vs. low ambiant temperatures |
| Division of CES with high vs. low ambiant humidity | |
| Division of CES with large vs. small humidity changes | |
| Division of CES with high vs. low bias electronics temperatures | |
| Division of CES with large vs. small bias electronics temperature change | |
| Division of CES with fast vs. slow electronics temperature changes | |
| Division of CES with high vs. low cryostat temperature | |
| Division of CES with large vs. small cryostat temperature changes | |
| The first half of the season vs. the second half of the season | |
| Division of CES based on whether the scan period is an integral multiple of the cryostat cold head pumping period |
| Category | Null test |
|---|---|
| Nine Instrumental Effects | *Three Divisions of modules by the bias and readout electronics boards they are connected to |
| *The central seven modules vs. the peripheral modules | |
| *Modules with high vs. low bandpass center frequencies | |
| Two divisions of top and bottom halves of the focal plane | |
| Left and right halves of the focal plane | |
| Alternatively-numbered modules | |
| Four Pointing Effects | *CES at high vs. low elevation |
| *CES with the patch rising vs. setting | |
| *2 Divisions of CES by deck angle | |
| One Source | *Far sidelobe elevation high vs. low (note that because of the orientation of the two far sidelobes a test for one's sidelobe elevation is degenerate with a test for the other's sidelobe elevation) |
| Seven Environmental Conditions | *Division of CES with high vs. low ambiant humidity |
| *Division of CES with high vs. low bias electronics temperatures | |
| *The first half of the season vs. the second half of the season | |
| Alternating CESes | |
| Middle season vs. extremes | |
| Alternate quarters of the season | |
| High vs. low precipitable water vapor |